Rooftop Solar Installation Model for ERP

Photo Credit: Image by Freepik
On this page: Rooftop Solar Installation leveraging a New-Build-Bulk-Fees model - Model 4 in the ERP Project Guidelines. Read more below, or visit Strategic Guidance for Country System Assessments, Guidance for Countries in Assessing ERC Projects, or Mobilizing ERC Finance.
Project Type: Renewable Energy
Sector: Power
Applicable Project Methodology: AMS-I.F.: Renewable electricity generation for captive use and mini-grid
This project type involves setting up Solar Photovoltaic (PV) Panels on the rooftops of various locations. The project can help to generate adequate energy supply that can primarily meet the energy needs of the buildings themselves, with any surplus electricity being supplied back to the grid. This helps to reduce greenhouse gas (GHG) emissions through reduced consumption of fossil fuel power supply.
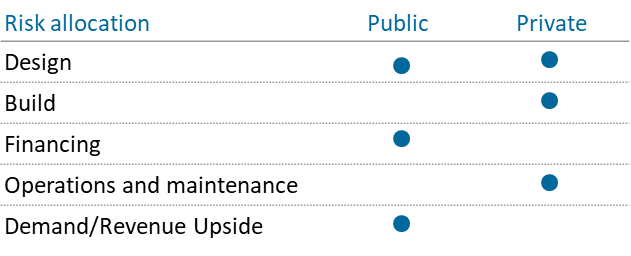
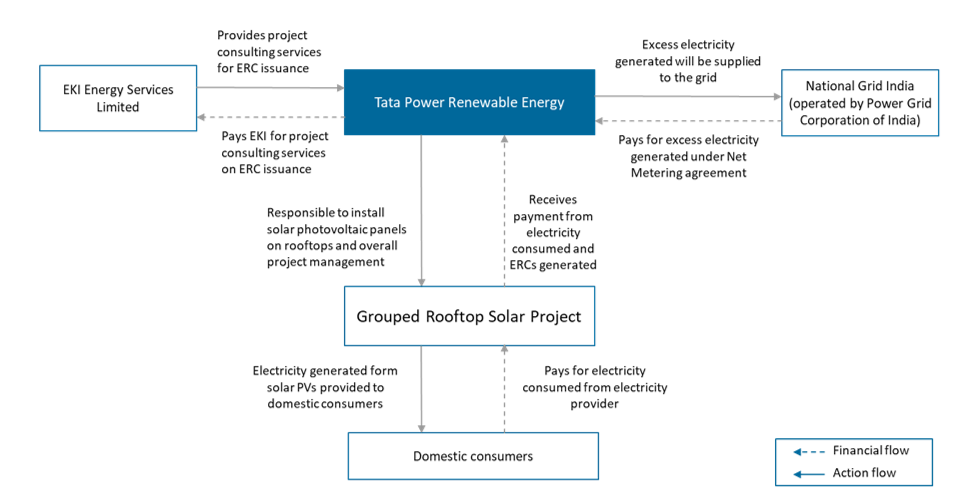
The project will be leveraging a New-Build-Bulk-Fees model. This will involve the grantor, potentially a municipal government or state-owned entity, creating a new entity to coordinate and manage the installation of rooftop solar systems across participating buildings in the region. The new entity will also be managing the emission reduction credit (ERC) project, for which it will receive the ERCs issued to the project for the avoided emissions. To recover the installation costs, the new entity will be collecting fees from the building owners benefiting from the energy efficiency savings through a 10-year period. Table 1: Model Attributes Business New This model assumes that a new state-owned entity will be created to manage the project Existing Construction Build The model involves the government or state-owned entity engaging a service contractor to install the rooftop solar systems in the participating buildings Refurbish Private Funding Finance The government or state-owned entity will provide initial financing for the project development in this model Service Bulk The government or state-owned entity will collect payments from the participating buildings User Revenues Fees The revenues in this model will be pre-agreed fees based on the savings to be incurred by the participants Tariffs Proposed risk allocation of the Public Private Partnership Model Key features of PPP structure Expected ERC end use Key considerations/risks for proposed project Figure 1: Financing and Activity Flows for the Model Project description The project entails the installation of Solar Photovoltaic (PV) Panels on rooftops across multiple states in India. The purpose of this project is to set up solar power plants primarily for self- consumption, and any excess electricity generated can be supplied to the grid. To achieve this, a net metering arrangement will be established with the state electricity board, allowing for the consumption of equivalent energy from the grid when necessary. Targeted results The annual average estimate of GHG emission reductions is 17,764 tonnes over a crediting period of 7 years. Figure 2: Structure of Case Study PPP The installation of Solar Photovoltaic (PV) Panels on rooftops in various Indian states is the focus of the project. Tata Power Renewable Energy is the project proponent for the various solar power plants grouped in this project. Through a net metering arrangement with the state electricity board, customers will consume equivalent energy from the grid, and they will only be charged for the net power they consume over a particular period. Excess electricity generated from the solar PV panels will be sold to the grid under the net metering agreement. Tata Power will also benefit from the payments received from consumers as well as any ERCs generated from this project. Assuming a similar project parameter as the case study, the project’s Net Present Value (NPV) without ERC in- and outflows – only considering non-ERC inflows through other revenue streams or cost savings enabled by the project – is negative at $ 0.7 million (M)1. With ERC cashflows, the project will improve to have a positive NPV of $ 0.6M, demonstrating the effectiveness of ERCs to enable the financial viability of such a project. Moreover, NPV of project may improve beyond project period as income from electricity sales recurs. Table 2: Summary of sources of inflows and outflows and key assumptions ERC revenues or inflows Average price of renewable energy project in Asia, Verified Carbon Standard (VCS) and Gold Standard (GS) Non-ERC revenues or inflows Solar Grouped Project case study benchmark, World Bank – Cost of Doing Business study, International Renewable Energy Agency (IRENA) Project investment and implementation cost Solar Grouped Project case study benchmark ERC generation Verra Fee Schedule Table 3: Net cashflows summary (in USD) ERC Component Revenues/Inflows 0 3,264,135 3,264,135 Costs/Outflows 0 -57,409 -57,409 Net value 0 3,206,726 3,206,726 Primary/Non-ERC Component Revenues/Inflows 0 6,923,150 6,923,150 Costs/Outflows -5,163,708 -1,807,298 -6,971,006 Net value -5,163,708 5,115,853 -47,855 Net Present Values NPV $651,345 NPV (ERC Component) $1,378,329 NPV (Non-ERC Component) -$726,984 Footnote 1: All prices are expressed in United States Dollars (USD)Proposed Structure of this Public Private Partnership (PPP) Model
Dimension
Attribute
Description

Case study: Grouped Rooftop Solar Project, India
Summary of the model financials
Value component
Assumptions
Sources
Components
Sum of initial outlays
Sum of in- or outflows from crediting period
Total cashflow
This section is intended to be a living document and will be reviewed at regular intervals. The Guidelines have not been prepared with any specific transaction in mind and are meant to serve only as general guidance. It is therefore critical that the Guidelines be reviewed and adapted for specific transactions. Unless expressly stated otherwise, the findings, interpretations, and conclusions expressed in the Materials in this Site are those of the various authors of the Materials and are not necessarily those of The World Bank Group, its member institutions, or their respective Boards of Executive Directors or member countries. For feedback on the content of this section of the website or suggestions for links or materials that could be included, please contact the PPPLRC at ppp@worldbank.org.
Updated: June 4, 2024
TABLE OF CONTENTS
UNLOCKING GLOBAL EMISSION REDUCTION CREDIT
Guidance for Countries in Assessing ERC Projects
1. Introduction to Emission Reduction Credits
• The World Bank's Emission Reduction Program
•Classification of Emissions Reduction Credit
• Policy Context of Emissions Reduction Credit
2. Objective of the Guidance for Countries in Assessing ERC Projects
• Objective of Project Preparation Guidelines
• Introduction to the Project Assessment Framework
• Process to Conducting Assessments
• S1: Green Economy Priorities
• S3: Article 6 Readiness and Eligibility
4. Conducting the Initial Profiling and Making a Preliminary Decision
• F2: Additional Value Enabled by Project
• C1, C2, and C3: Carbon Integrity and Environmental and Social Risk Management
5. Conducting the Project Assessment and Making the Final Decision
• F1: Project ERC value and F2: Additional Value Enabled by Project
• Q2: Marketing, Sales, and Pricing
• Q3: Project Governance and Structure
• C2: Environmental Risk Management
• C3: Social Risk Management and Benefits
6. Further Guidance for Application
• Country Context-driven Factors
• Considerations for Future Scope
Abbreviations: Guidance for Countries in Assessing ERC Projects
• B: Project Assessment Template
- Model 1: MRT Energy Efficiencies Model for ERP
- Model 2: Rural Electrification Model for ERP
- Model 4: Rooftop Solar Installation Model for ERP
- Model 5: LED Streetlight Deployment Model for ERP - for Specific Technologies
- Model 6: E-bus Deployment Model for ERP
- Model 7: EV Charging Systems Installation Model for ERP
- Model 8: Biodigesters Deployment Model for ERP
- Model 9: Waste-to-Power Model for ERP
- Model 10: Waste Treatment Facility Model for ERP
- Model 11: Climate Smart Farming Deployment Model for ERP