MRT Energy Efficiencies Model for ERP
Photo Credit: Image by Freepik
On this page: MRT Energy Efficiency Deployment leveraging an Existing-Refurbish- User-Tariffs model - Model 1 in the ERP Project Guidelines. Read more below, or visit Strategic Guidance for Country System Assessments, Guidance for Countries in Assessing ERC Projects, or Mobilizing ERC Finance.
Project Type: Energy efficiency (Transportation)
Sector: Energy - Transport
Applicable Project Methodology: ACM0016 Mass Rapid Transit Projects
The project's main objective is to replace the traditional electro-dynamic rheostatic braking technology used in mass rail transit systems with regenerative braking technology. This new system can generate electrical energy by harnessing the kinetic energy of decelerating rolling stock. This helps to reduce reliance on grid electricity therefore reduce greenhouse gas emissions from mass rail transit systems.
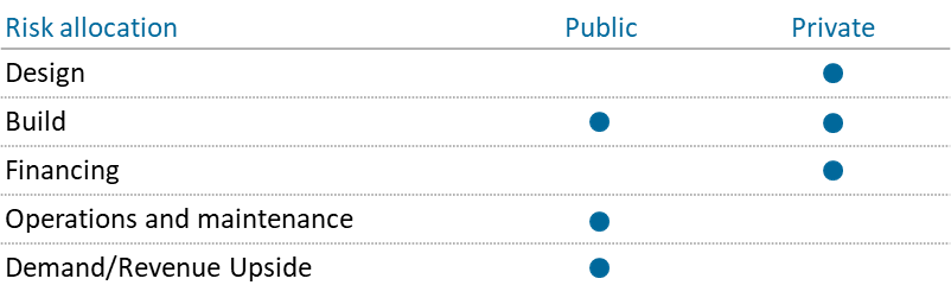
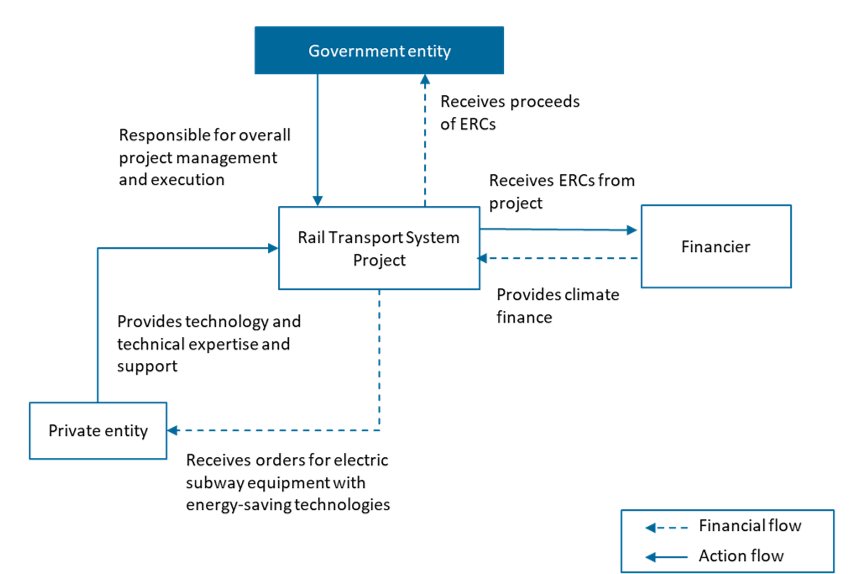
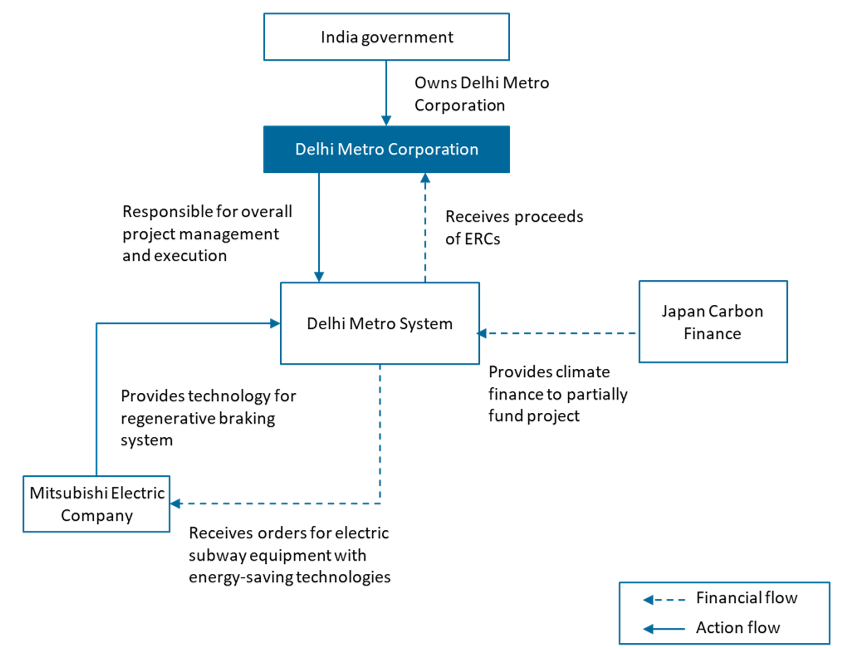
The project will be leveraging an Existing-Refurbish- User-Tariffs model. This will involve the state- owned entity with the existing mandate to operate the mass transit system to improve the energy efficiency of its current assets through refurbishment. The private company engaged to install the technology will be provided financing by the state-owned entity to undertake the refurbishment activities. Table 1: Model Attributes Business New This model involves making energy efficiency Existing Construction Build The model involves the project company installing the Refurbish Private Funding Finance The state-owned entity is expected to finance the Service Bulk The state-owned entity currently delivers services to commuters using the mass transport services User Revenues Fees Revenues in this model will continue to be the tariffs collected from commuting users for transport services Tariffs Proposed risk allocation of the Public Private Partnership Model Key features of PPP structure Key considerations/risks for proposed project Figure 1: Financing and Activity Flows for the Model Project description The Delhi Metro Rail project uses low GHG emitting rolling stocks with regenerative braking technology to conserve electrical energy and reduce GHG emissions. Conventional electro- dynamic rheostatic braking technology is replaced with regenerative braking technology in the rolling stocks. This system uses 3 phase AC traction motors and consists of two units each with a Driving Trailer car and a Motor Car. The regenerative braking system generates electrical energy by converting the kinetic energy of decelerating rolling stock, reducing the consumption of grid electrical energy and subsequent GHG emissions. The project involves installing these low GHG emitting rolling stocks in 3 service lines which are Shahdara-Rithala; Vishva Vidyalaya-Central Sectt.; and Indraprastha-Dwarka-Sub City. These lines are expected to serve an estimated 2,182,000 passengers on a daily basis. Targeted results Expected annual ERCs generated from the program will be 41,160 tonnes. Figure 2: Structure of Case Study PPP The project is partly financed by the Government of Japan through Japan Carbon Finance Ltd. Mitsubishi Electric fulfilled orders for energy-efficient electric subway equipment from the Delhi Metro Corporation, which included locomotive products equipped with electric power generating brake systems. Overall project management and execution was by the Delhi Metro Corporation. Assuming a similar project scale, context and arrangements as in the case study of installing rolling stocks in a metro system that serves an estimated 2 million (M) passengers, the project’s Net Present Value (NPV) without ERC in- and outflows – only considering non-ERC inflows through other revenue streams or cost savings enabled by the project – is positive at $15.5M1. With ERC cashflows, the total project will have a greater positive NPV of $16M, which makes these types of mass rail transit systems projects more financially attractive. The revenues generated from ERCs helped to provide additional justification to pursue the project despite its high upfront capital expenditure. Table 2: Summary of sources of inflows and outflows and key assumptions ERC revenues or inflows Average price of Transport project in Asia, registered under Verified Carbon Standard (VCS) Non-ERC revenues or inflows Delhi Metro Corporation (DMC) case study benchmark, World Bank – Cost of Doing Business study Project investment and implementation cost DMC case study benchmark ERC generation Verra Fee Schedule Table 3: Net cashflows summary (in USD) ERC Component Revenues/Inflows 0 1,590,915 1,590,915 Costs/Outflows 0 -104,716 -104,716 Net value 0 1,486,199 1,486,199 Primary/Non-ERC Component Revenues/Inflows 0 79,590,336 79,590,336 Costs/Outflows -26,005,607 -1,300,280 -27,305,887 Net value -26,005,607 78,290,055 52,284,448 Net Present Values NPV $16,030,635 NPV (ERC Component) $565,106 NPV (Non-ERC Component) $15,465,529 Footnote 1: All prices are expressed in United States Dollars (USD)
Proposed Structure of this Public Private Partnership (PPP) Model
Dimension
Attribute
Description
improvements to existing mass transport infrastructure
regenerative braking technology to existing trains
installation of the regenerative braking technology
Case Study: Installation of Low Greenhouse Gases (GHG) Emitting Rolling Stock Cars in Metro System, India
Summary of the Model Financials
Value component
Assumptions
Sources
Components
Sum of initial outlays
Sum of in- or outflows from crediting period
Total cashflow
This section is intended to be a living document and will be reviewed at regular intervals. The Guidelines have not been prepared with any specific transaction in mind and are meant to serve only as general guidance. It is therefore critical that the Guidelines be reviewed and adapted for specific transactions. Unless expressly stated otherwise, the findings, interpretations, and conclusions expressed in the Materials in this Site are those of the various authors of the Materials and are not necessarily those of The World Bank Group, its member institutions, or their respective Boards of Executive Directors or member countries. For feedback on the content of this section of the website or suggestions for links or materials that could be included, please contact the PPPLRC at ppp@worldbank.org.
Updated: June 4, 2024
TABLE OF CONTENTS
UNLOCKING GLOBAL EMISSION REDUCTION CREDIT
Guidance for Countries in Assessing ERC Projects
1. Introduction to Emission Reduction Credits
• The World Bank's Emission Reduction Program
•Classification of Emissions Reduction Credit
• Policy Context of Emissions Reduction Credit
2. Objective of the Guidance for Countries in Assessing ERC Projects
• Objective of Project Preparation Guidelines
• Introduction to the Project Assessment Framework
• Process to Conducting Assessments
• S1: Green Economy Priorities
• S3: Article 6 Readiness and Eligibility
4. Conducting the Initial Profiling and Making a Preliminary Decision
• F2: Additional Value Enabled by Project
• C1, C2, and C3: Carbon Integrity and Environmental and Social Risk Management
5. Conducting the Project Assessment and Making the Final Decision
• F1: Project ERC value and F2: Additional Value Enabled by Project
• Q2: Marketing, Sales, and Pricing
• Q3: Project Governance and Structure
• C2: Environmental Risk Management
• C3: Social Risk Management and Benefits
6. Further Guidance for Application
• Country Context-driven Factors
• Considerations for Future Scope
Abbreviations: Guidance for Countries in Assessing ERC Projects
• B: Project Assessment Template
- Model 1: MRT Energy Efficiencies Model for ERP
- Model 2: Rural Electrification Model for ERP
- Model 4: Rooftop Solar Installation Model for ERP
- Model 5: LED Streetlight Deployment Model for ERP - for Specific Technologies
- Model 6: E-bus Deployment Model for ERP
- Model 7: EV Charging Systems Installation Model for ERP
- Model 8: Biodigesters Deployment Model for ERP
- Model 9: Waste-to-Power Model for ERP
- Model 10: Waste Treatment Facility Model for ERP
- Model 11: Climate Smart Farming Deployment Model for ERP