ERC Market Status

Photo Credit: Image by Freepik
On this page: After a period of rapid growth in ERC supply and market value, ERC markets faced multiple headwinds in 2022 and 2023. Read more below, or visit Strategic Guidance for Country System Assessments, Guidance for Countries in Assessing ERC Projects, or Mobilizing ERC Finance.
After a period of rapid growth in ERC supply and market value, ERC markets faced multiple headwinds in 2022 and 2023. Over 512 million ERCs were issued in 2022, a slight decrease from 2021, but a 46% increase from 2020 (Figure 3).1 The total value of ERCs transacted through the VCM, the largest market segment, increased from $520 million in 2020 to $2.1 billion in 2021, a significant year-over-year increase of more than 400%.2 The market’s growth slowed in 2022, decreasing slightly to $1.9 billion.3 Prices for ERCs, while varying widely, grew from a global average of $2.49 / tCO2e in 2020 to $3.82 / tCO2e in 2021.4 In 2022, prices of exchange-traded ERCs dropped significantly following Russia’s invasion of Ukraine then continued to steadily decline over the rest of the year, but the average over-the-counter (OTC) price increased an estimated 70% to $6.83 / tCO2e in 2022.5 OTC trading remains the primary means of ERC transactions, but transactions on public exchanges have also increased in recent years; while the volume of ERCs traded on Xpansiv’s CBL global exchange platform decreased slightly in 2022, the value of ERC transactions on the platform totalled $795 million, a 44% increase over 2021.6 While comprehensive data is not yet available for 2023, data from 20 major crediting programs shows that, as of September 30, 2023, over 261 million ERCs had been issued at an estimated value of $1.2 billion, compared to over 312 million ERCs issued at the same value in the same period in 2022.7 Despite a year-over-year decrease of 16% in year-to-date ERC issuances, ERCs were trading at an average price of $4.47 / tCO2e through the first three quarters of 2023. This is up from an average price according to the same data of $4.08 and $4.06 in 2021 and 2022, respectively, consistent with a shift in demand towards higher quality and valued ERCs.8 The growth of ERC markets has been hindered by recent concerns surrounding baselines, additionality, permanence, and the equitable distribution of ERC revenues to key stakeholders, primarily Indigenous Peoples and local communities (IPLCs). While many experts maintain a positive outlook on the VCM's potential, it is evident that addressing these issues is critical for upholding the integrity of ERC markets and scaling financing for ERC generation. Figure 3: Annual ERC trade by value and volume and Figure 4: Annual ERC issuance by crediting mechanism type ERCs are predominately issued under independent crediting mechanisms, but issuance under international mechanisms is on the rise (Figure 4). Annual ERC issuance from independent crediting mechanisms—standards managed by independent, non-governmental entities such VCS and Gold Standard—increased 88% in 2021 to 355 million ERCs, comprising 68% of the global supply that year. That fell to 276 million ERCs in 2022 or 54% of global supply, while ERCs issued through international crediting mechanisms, which are governed by international climate treaties, rose from a slump of 51 million and 22% of the global total in 2019 to 150 million or 29% of all credits issued in 2022. This trend is currently driven by issuance through the CDM, which is winding down, but may continue in future as the result of recent policy developments, including the gradual implementation of Article 6 of the Paris Agreement. China has driven a significant increase in ERC supply in the EAP region in recent years, while ERC supply from other countries in the region continues to fluctuate. Considering most independent crediting mechanisms and the Clean Development Mechanism, over 1.9 billion ERCs have been issued across the EAP to date, 72% of which were generated in China (~1.4 billion). Excluding China, South Korea was the greatest generator of ERCs (~206 million), followed by Indonesia (~141 million), Cambodia (~63 million), and Vietnam (~44 million).9 Demand for ERCs is expected to grow exponentially this decade in response to an increasing global focus on climate action. Entities representing at least 61% of GHG emissions, 68% of global GDP, and 56% of the world’s population have net-zero commitments in place.10 While the long-term role of ERCs in meeting net-zero commitments remains to be seen (e.g., ERCs cannot be used for offsetting claims under VCMI’s Claims Code11), the demand for ERCs is expected to continue to grow rapidly. As a result, global demand from the VCM alone could increase by 15 times by 2030, compared to demand in 2020,12 and the VCM could reach $190 billion by 2030.13 Governments are also steadily increasing implementation of compliance carbon pricing instruments, with 73 carbon taxes or ETS currently in place covering 23% of GHG emissions. Some of these permit use of ERCs to meet compliance obligations and more countries are looking to set up pricing mechanisms alongside domestic crediting mechanisms.14 Footnote 1: World Bank, Carbon Pricing Dashboard, accessed September 4, 2023. Footnote 2: Ecosystem Marketplace, The Art of Integrity – State of the Voluntary Carbon Markets 2022 Q3, Forest Trends Association, 2022. Note: 2021 data was updated by Ecosystem Marketplace in 2023. Footnote 3: Ecosystem Marketplace, All in on Climate: The Role of Carbon Credits in Corporate Climate Strategies, 2023. Footnote 4: World Bank, State and Trends of Carbon Pricing 2022, 2022. Footnote 5: World Bank, State and Trends of Carbon Pricing 2023, 2023. Footnote 6: World Bank, State and Trends of Carbon Pricing 2023, 2023. Footnote 7: Pollination analysis based on AlliedOffsets subscription data, accessed October 23, 2023. Note this data is based on registry data of 20 major registries, including Australian Carbon Credit Units, Acorn, American Carbon Registry, Architecture for REDD+ Transactions, City Forest Credits, Climate Action Reserve, Cercarbono (listed on EcoRegistry), Clean Development Mechanism, ColCX, Gold Standard Impact Registry, Joint Crediting Mechanism, Label Bas Carbone, Nori, BioCarbon (formerly ProClima), Peatland Code, Plan Vivo, Puro.earth, Universal Carbon Registry, Verra, and Woodland Carbon Code. Footnote 8: Carbon Direct, 2023 State of the Voluntary Carbon Market, 2023. Footnote 9: AlliedOffsets subscription data, accessed September 11, 2023. Note this data is based on registry data of 11 major independent registries, including Acorn, American Carbon Registry, Architecture for REDD+ Transactions, Climate Action Reserve, Clean Development Mechanism, Gold Standard, Label Bas Carbone, Nori, ProClima/BioCarbon Registry, Puro.earth, and Verra. It is not a complete database of all ERCs issued and explicitly excludes many national crediting mechanisms. However, it does provide ERC issuance data that is disaggregated by country, which is a useful reference in this context. Footnote 10: Energy and Climate Intelligence Unit, Taking Stock: A global assessment of net zero targets, 2021. Footnote 11: Environmental Finance, VCMI carbon credit claims ‘cannot be used for offsetting, 2023. Footnote 12: Taskforce on Scaling Voluntary Carbon Markets, Final Report, 2021. Footnote 13: BloombergNEF, Long-Term Carbon Offset Outlook 2022, 2022. Footnote 14: World Bank, State and Trends of Carbon Pricing 2023, 2023.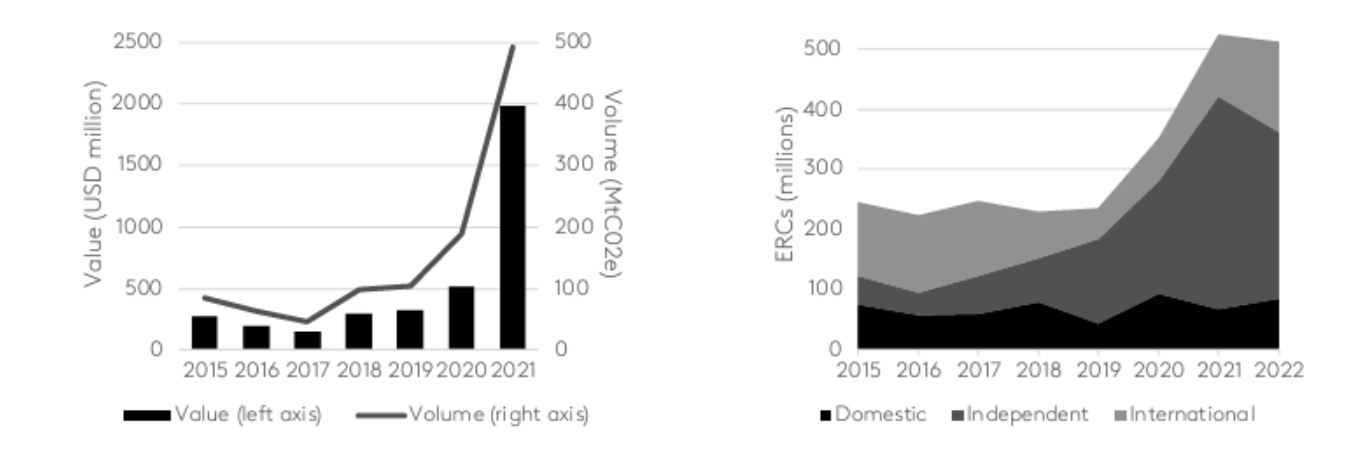
This section is intended to be a living document and will be reviewed at regular intervals. The Guidelines have not been prepared with any specific transaction in mind and are meant to serve only as general guidance. It is therefore critical that the Guidelines be reviewed and adapted for specific transactions. Unless expressly stated otherwise, the findings, interpretations, and conclusions expressed in the Materials in this Site are those of the various authors of the Materials and are not necessarily those of The World Bank Group, its member institutions, or their respective Boards of Executive Directors or member countries. For feedback on the content of this section of the website or suggestions for links or materials that could be included, please contact the PPPLRC at ppp@worldbank.org.
Updated: June 3, 2024
TABLE OF CONTENTS
UNLOCKING GLOBAL EMISSION REDUCTION CREDIT
1. Introduction to Emission Reduction Credits
• The World Bank's Emission Reduction Program
• Classification of Emissions Reduction Credit
• Policy Context of Emissions Reduction Credit
• Current Landscape of ERC Financing
• Financing structures to address key risks
• Debt: Example of Emission Reduction-Linked Bond from Vietnam
• Equity: The London Stock Exchange and Foresight Sustainable Forestry
• Fund: Liveligoods Carbon Fund 3
3. Key Enablers of ERC Finance
• Credit Risk in ERC Finance Transactions
• Political Risk for ERC Activities
• Rights to ERCs and Their Benefits
• Government Engagement and Public Sector Participation
4. Scaling Finance for ERC Generation
• Key Findings to Scale Up Private Sector Capital for ERC Activities
• Expand ERC-Backed Debt Issuance
Related Content
Additional Resources
Emission Reduction Credits
Type of ResourceRight Block TitleTABLE OF CONTENTSSector-Specific Content on Climate-Smart
Energy and Power PPPs